For the last two decades, India’s approach to electronic governance has evolved leaps and bounds. In 2004, the introduction of basic e-governance websites marked a simple (and still ongoing) shift from the offline to the online realm, promising to bring the state closer to the people. Over time, it expanded in scope to include large-scale digitalization of products and services, especially in safety-critical sectors like healthcare and banking, through the adoption of Digital Public Goods and Infrastructures. With Artificial Intelligence (AI) technologies now becoming the latest investment imperative, the concept of e-governance has been further redefined to include everything from automated chatbots and ‘agentic’ resource management software to diagnostic systems and facial recognition technologies.
Why are we here?
Central to this ‘digital overhaul’ has been a class of private companies that have worked “alongside the government to plan, design, and implement complex IT-intensive public service projects.” These partnerships have helped further the process of digitalization and certainly increased the pace with which new initiatives have been rolled out. However, this dependency is not without its pitfalls. Firstly, this form of long-term outsourcing has affected the state’s capabilities to create effective e-governance solutions in-house, especially as more complex use-cases have emerged. Secondly, and more importantly, this reliance on private firms has not been limited to the last-mile solutions alone, but also includes the hosting of potential public services on privately-controlled infrastructures, such as cloud platforms, among others.
As a result, the dominance of US-based Big Tech firms as market leaders means that the outsourcing of critical infrastructures is accompanied with the creation of both technical and geopolitical vulnerabilities.
These factors have been complicated by the ways in which political considerations have come to bear on the digital economy, particularly the aggressive stance the US has taken in this regard. As a result, the dominance of US-based Big Tech firms as market leaders means that the outsourcing of critical infrastructures is accompanied by the creation of both technical and geopolitical vulnerabilities. Recent experience shows that the former includes large-scale server outages, and the latter includes intentional decisions by service providers to cut off access to critical facilities. Grounding these concerns in the Indian context and understanding e-governance’s exposure to private incentives requires further work, and we tried answering the following questions to that end:
- How much of the e-governance infrastructure relies on private actors and hyper-scalers?
- How does this reliance vary between different sectors, states, and levels of digital maturity?
- Lastly, what can we say about the consolidation of critical governance infrastructure with a handful of BigTech entities?
What did we do?
As you may have already noted, the previous section contains too broad a question set for any single research exercise to answer. E-governance, after all, is an overarching category that includes everything from simple webpages to more complex digital goods and services. Therefore, to provide an informed starting point for our hypotheses and to refine our lines of inquiry, we conducted a preliminary analysis on a limited, but significant, proportion of the e-governance spectrum, i.e., government-affiliated websites.
After data cleaning, our sample consisted of over 6000 weblinks sourced from the Integrated Government Online Directory (IGOD) — an official repository of Indian government websites, organized along clear sectoral boundaries. The following table lists ten sectors that find prominence in our sample, together forming over 75% of our data.
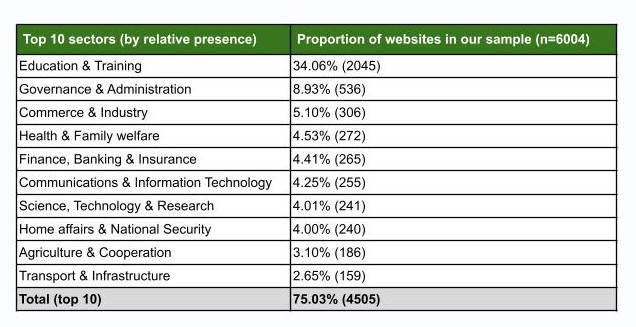
Table 1: Top 10 Sectors in Websites Sampled
These data were gathered from the portal between May and June 2025, after which we conducted a nameserver lookup and a domain name server (DNS) mapping exercise for each of the websites. The IP address(es) acquired through these mappings were then processed through ‘WhoIs’ commands, which led us to access key details about the owner of the IP block to which these addresses belong. It is this final detail that gives us an insight into the service provider, private or public, hosting a particular website. The figure below provides an overview of our research methodology and the two levels of our analysis.
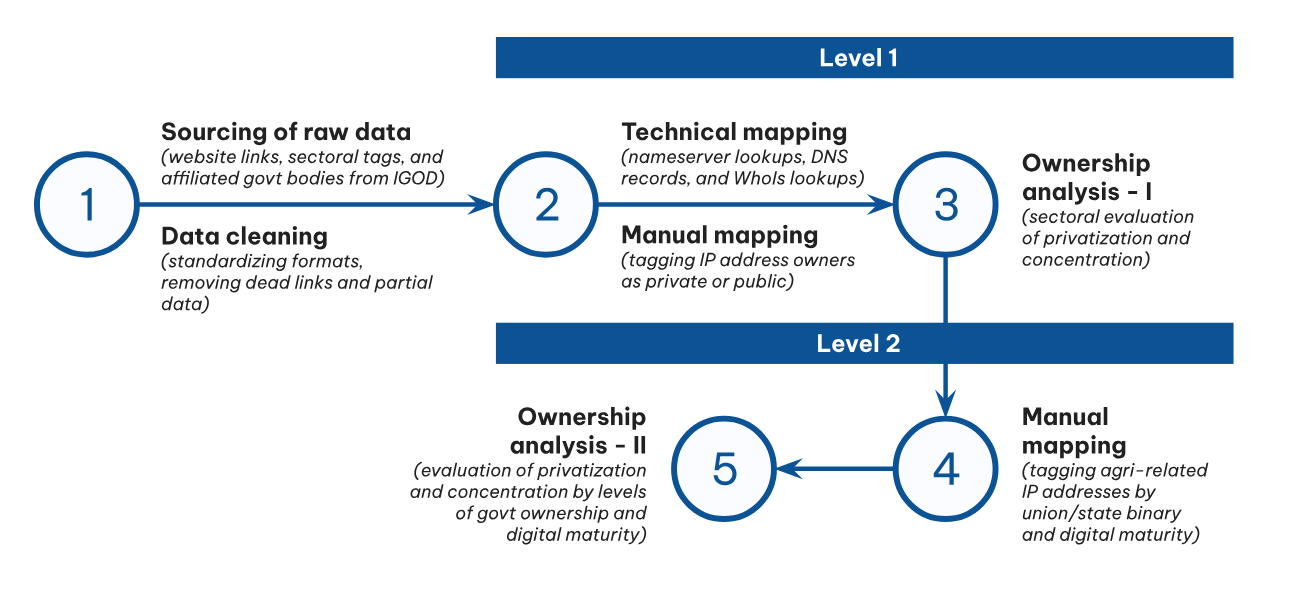
Figure 1: Methodology and analysis
To account for the often distributed nature of web hosting and other uncertainties, we also validated our results with freely available and trustworthy third-party sources, such as ICANN’s lookup tool, the DNS Historical Record Archive, and ViewDNS.info, among others. At the end of this process, we undertook a manual classification of the IP owners into ‘public’ and ‘private’ categories — the former including organisations like the National Informatics Centre, the National Knowledge Network, and BSNL, whereas the latter comprising the likes of Amazon, Google, Microsoft, Cloudflare, and CyFuture, among others.
While level one gave us critical insight into our dataset, some of our hypotheses about the factors that contribute to an IP address’s ownership status remained unanswered. In level two of our analysis, we dug into the 186 websites from our sample that were categorized as ‘Agriculture and Cooperation’ — to learn more about how ownership patterns change within a single sector, but between i) websites affiliated with the union government and those with the state governments, and ii) websites with varying maturity stages of digital capabilities.
As an illustration of the complete process, consider the websites of the union government-affiliated AgMarknet portal (agmarknet.gov.in) and the Kerala government-affiliated Agriculture Information Management System (www.aims.kerala.gov.in). The results of their nameserver lookup, DNS mapping, and WhoIs lookup are provided below, along with their categorisation across a three-stage taxonomy of relative digital maturity.1
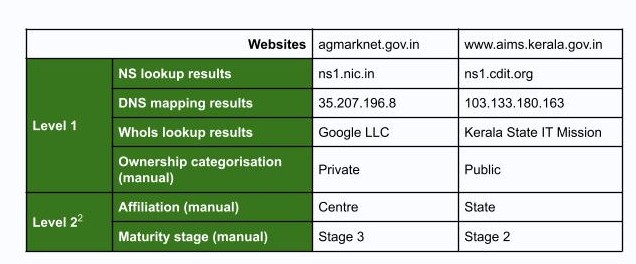
Table 2: Results of the nameserver lookup
In the next section, we discuss two key trends that we can identify from these analyses. More specifically, we highlight patterns of private ownership of critical web infrastructures (including large-scale presence of BigTech entities in certain cases) and its implications for the goals of digital sovereignty, cybersecurity, and market fairness.
What did we find?
By capturing organizational details about the hosting service provider (HSP) for each website resource, we set out to explore two primary themes of analysis — privatization and concentration. Let’s explore these one by one.
HSP privatization (or, how much of our sample is hosted by private HSPs?)
On the whole, 26.7% (or 1604 of the 6004 links analysed) were hosted by private actors — a number in line with some existing estimates. However, this all-compassing figure hides a few key trends. Firstly, we find rates of HSP privatization (measured by the proportion of websites hosted by private HSPs) varying starkly across the different sectors. As the figure below indicates, certain sectors like Chemicals and Fertilizers, or Tourism, see high rates of HSP privatization, whereas those such as Defence and Home Affairs & National Security, see relatively lower rates.
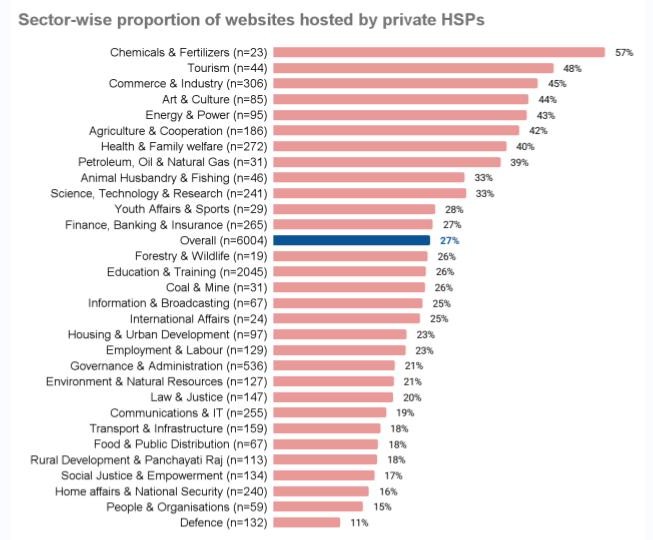
Figure 2: Sector-wise proportion of websites hosted by private HSPs
Secondly, our sub-analysis of websites tagged to Agriculture and Cooperation, reveals that this rate further varies between websites affiliated with central departments and ministries, and those affiliated with state departments and ministries. We also see that websites with relatively higher degrees of digital maturity witness higher rates of HSP privatization, as compared to their less mature counterparts.
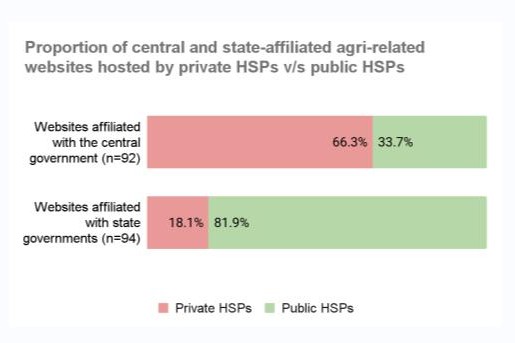
Figure 2.1: Proportion of central and state-affiliated agri-related websites hosted by private HSPsv/s public HSPs
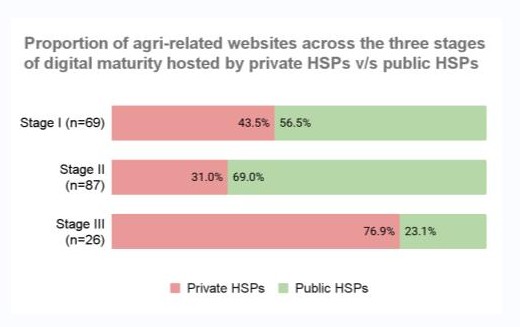
Figure 2.2: Proportion of agri-related websites across stages of digital maturity hosted by private HSPs v/s public HSPs
HSP concentration (or, what are the relative market shares of HSPs, particularly in the private market?)
Given that about three-quarters of our sample is hosted by public HSPs, the market share of any single private player is, inevitably, low. As the figure below indicates, 53% of the websites are hosted on IP addresses owned by the NIC, whereas Amazon (the private HSP with the largest market share) comes second with only 4% of the websites hosted on its infrastructure.
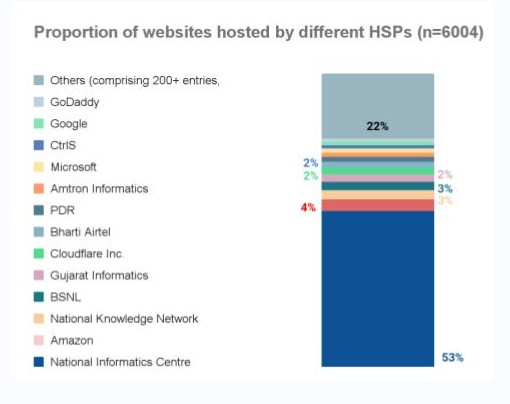
Figure 3: Proportion of websites hosted by different HSPs (n=6004)
Whilst NIC’s overwhelming dominance as an HSP here is undeniable, it should also be noted that this dominance is far from being consistent. In sectors with higher-than-average rates of HSP privatization (refer to the table below), it is inevitable that NIC’s market share should dip, which is often distributed across a range of small private HSPs.
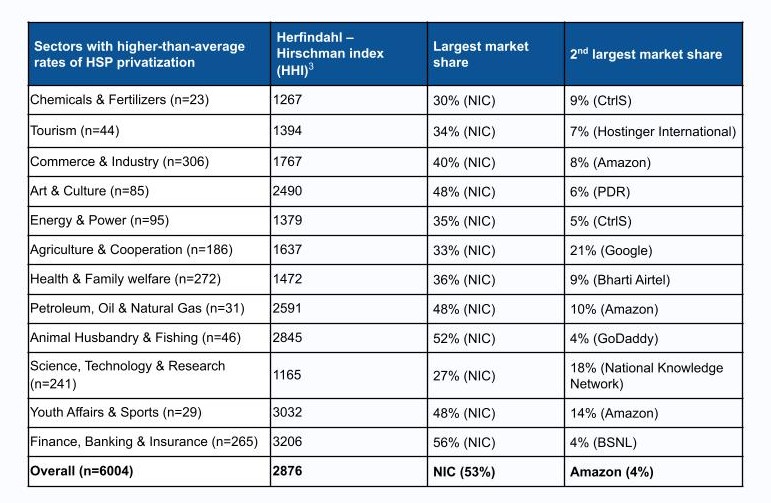
Table 3: Sectors with higher-than-average rates of HSP privatization
However, data from sectors like Agriculture and Cooperation also point to a unique and revealing trend. Instead of a long tail of small private competitors, we see Google Cloud — a multinational hyperscaler — hosting over 21% of government-affiliated websites for this sector, as compared to NIC’s 33%. A similar form of emerging BigTech control is also seen in sectors such as Youth Affairs & Sports and Information & Broadcasting — albeit to lesser extents.
Our level two analysis shows that trends of concentration further vary across the centre-state binary as well as across the maturity classifications. Over 45% of agri-related websites affiliated with the central government are hosted with BigTech hyperscalers, whereas the ratio is about 3% among state government-affiliated websites. Revealingly, this large gap is not found in other ‘small-scale’ private HSPs, which see largely equal splits in both cases (21% and 15%, respectively).
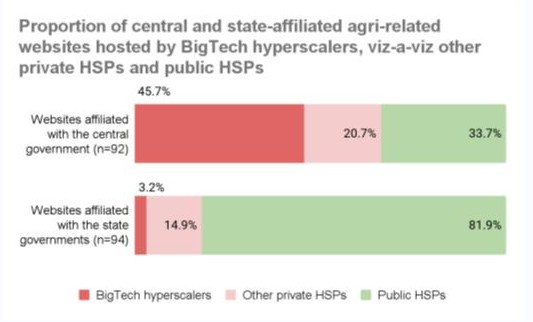
Figure 4.1: Proportion of central and state-affiliated agri-related websites hosted by BigTech hyperscalers, viz-a-viz other private and public HSPs
This trend can also be witnessed between websites on varying stages of digital maturity, with more ‘mature’ websites predominantly being hosted by BigTech HSPs.
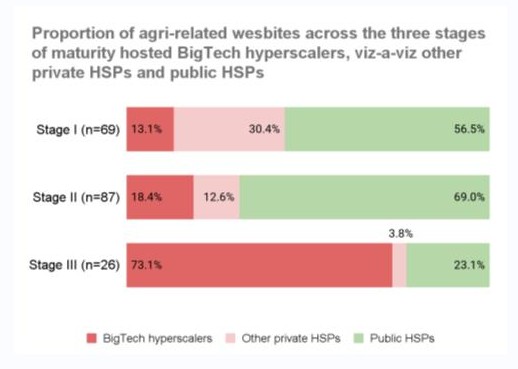
Figure 4.2: Proportion of agri-related websites across the three stages of maturity hosted by BigTech hyperscalers, viz-a-viz other private HSPs and public HSPs
What next?
As we’ve alluded to before, the results shared above are from an exploratory exercise, the goal of which was to identify our limitations, inform our hypotheses, and refine our research questions. To that end, we first list below a few critical insights that caught our eye.
- Sectoral and geographic variations in rates of HSP privatization and the HHI highlight an uneven and fragmented process of HSP procurement. This merits a deeper look into the federated nature of vendor onboarding and how multiple rules and regulations intersect and interact at the ministerial and local levels.
- The overwhelming dominance of NIC and other public entities as HSPs is most likely a falling trend, at least in the few sectors that our research has identified. How much of this market share is transferred to already dominant BigTech entities should remain a critical area of inquiry — especially in sectors with potential for large-scale digital ‘disruption.’
- However, to enable more rigorous analyses and more equitable policy-making, it is imperative that information about vendor procurement for core digital infrastructures be made more transparent. This not only includes quantitative data about open RfPs, but also simplified access to private MoUs and other PPP agreements signed by government organisations.
Going forward, we also plan to tweak our research approach to solve for a few key limitations. First, the list of websites was sourced from a static online database, and our goal would be to enrich the repository and make it more representative of the evolving nature of web hosting. Second, we’ll be replicating our level two analysis across other safety-critical sectors with high rates of privatization, such as Education and Training, or Health and Family Welfare. Finally, we will also be aiming to broaden our analytical scope and focus on more mature forms of e-governance technologies — like mobile applications, stack-driven DPGs and DPIs, and the many AI technologies being deployed by the state. In line with our early findings, we expect these instances to indicate higher levels of private sector involvement, in comparison to basic websites.
As we account for our takeaways and insights, we are also intrigued by a few second-order questions that we can now see more clearly. We list them below as food for thought, and likely areas of inquiry in our future work:
- In the current geopolitical era of digital industrialisation, how can India’s core technical infrastructure be secure from transnational dependencies and made independent of global capital flows?
- With growing privatization in e-governance, how can public procurement be used as a market-shaping tool, i.e., not only to encourage digitisation but to intentionally enable technologies that serve the public interest?
- What are the ways in which existing institutions, policies, and politics are tweaked to achieve this goal? At the same time, in what ways should these dimensions be replaced altogether, to deliver on a more inclusive and equitable governance structure?
1 The three-stage categorisation used for this exercise has been built using existing e-governance maturity frameworks (primarily Khalid and Lavilles (2019), accessible here). For the purposes of our discussion, it can be understood in the following manner —
- Stage I: One-way information sharing websites, often with basic contact pages and multilingual abilities
- Stage II: Websites that allow for file downloads, provide access to basic data and graphs, and display limited login functionality
- Stage III: Websites with full login functionalities, e-service delivery options, and two-way information sharing processes
2 This level included only the 186 websites tagged as ‘Agriculture and Cooperation’
3 The HHI is a measure of market consolidation and is calculated by squaring and adding up each firm’s market share, in whole numbers. The higher the HHI, the more concentrated a market is, and vice-versa. In our case, the proportion of unique websites hosted by each HSP is used as a measure for each firm’s market share. For more details, refer to this explanation.